There are many visualization tools out there - Tableau, Microstrategy, Qlik, Apache Zeppelin and may more. Then why would we need another visualization solution. We thought about the same but as we were building a comprehensive unified data platform visualization was a core component. Visualization solution is integrated with our metadata, security and governance layer seamlessly.
Dashboard solution is built to enable organizations quickly explore, analyze patterns and build dashboards with rich visualization charts. Dashboards can use real time charts, ad-hoc queries or periodic data refreshes. It provides drill down capability, exploration of chart data, data dictionary and data lineage to give complete view to the user. Solution integrates with Metadata Store and Data Governance solutions. Role and user based access is allowed at individual chart level.
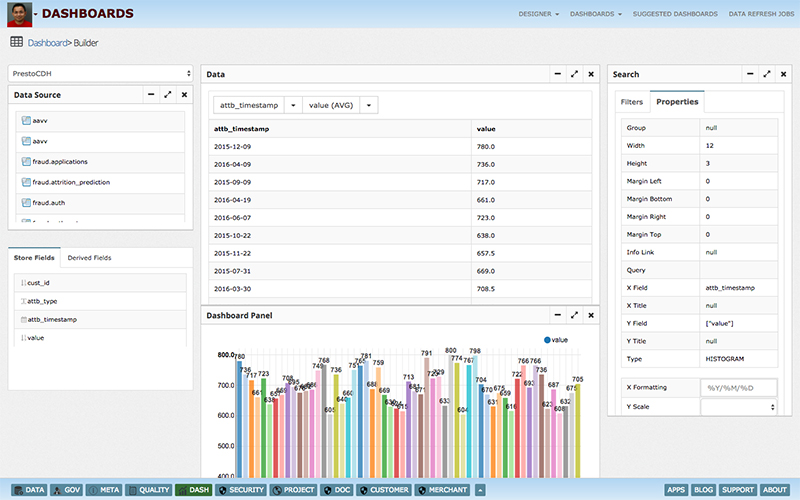
Visual builder provides drag and drop features to build charts very easily. Any data source could be used like Kafka, Database, SOLR, Elastic Search etc. Fields from data source can be dropped on the data section. Complex fields (derived fields) can be built using rich function library. Different filters like numeric, string, date time etc can be applied easily. Finally properties can be used to create different charts like Histogram, Pie, Map etc..
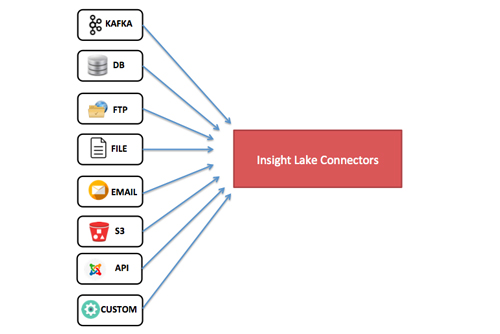
Dashboard solution collects data from various sources using integrated metadata layer.
Data sources can be real time sources like Kafa or persistent stores like databases, HDFS, S3, SOLR, Elastic Search etc.
A new query language was defined to work with these data sources seamlessly.
InsightLake platform's metadata layer on data sets and query language allows creation of simple and complex data sets, which can then be used for dashboards. Users can do the following:
1 Create derived fields
2 Create new data set by doing Join, Union or Transpose
3 Apply custom queries
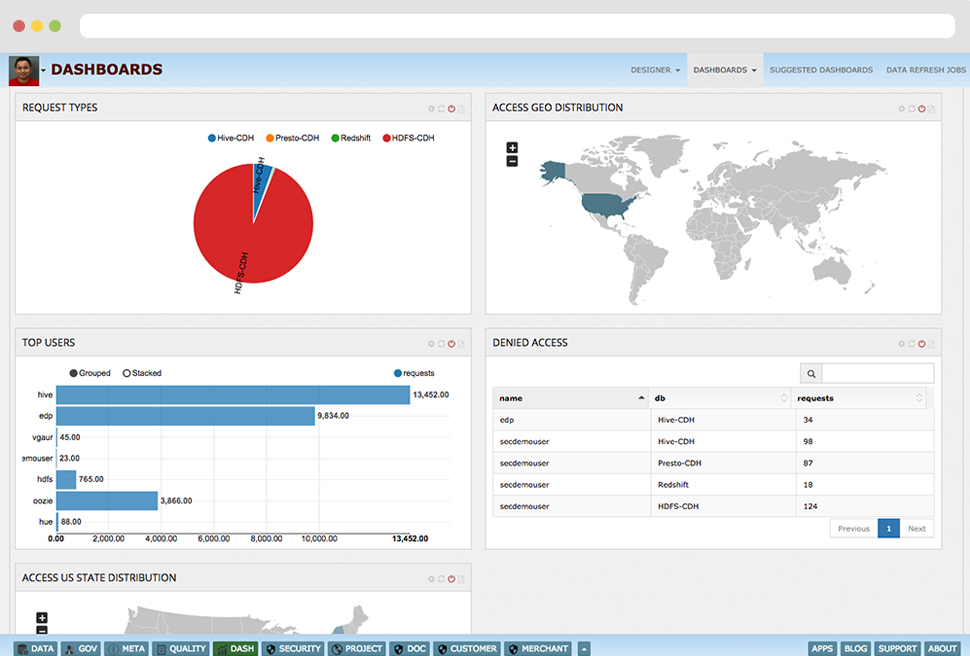
Users can build a nice data story by putting various charts in a dashboard. They can customize the look and feel of the dashboard panels easily.
Business users can use drill down feature and narrow down to data elements to get the clarity. They can simply click on chart elements like bar of bar chart, Pie of Pie chart, Table row, Map state or country etc and selected filter gets applied to relevant charts of the dashboard, which then redraws all the charts taking only filtered data.
Dashboard solution speeds up chart building with automatic dashboard suggestion feature. It allows users to select appropriate data source and data store (Table, Kafka Topic, File etc) and backend automation algorithm understands the data and suggests set of dashboards/charts, which can be easily added to a new report with button click.
Business users can build operational dashboards where real time events are fed to charts, which gets updated in real time. For example using real time dashboard users can build charts on Kafka events and show how them live on dashboards.
Fast charts can be built using periodic refresh mode. In this mode backend engine refreshes the data and charts periodically. Users can turn on or off this feature using a simple click on real time icon on charts.

When business users are looking at the charts, it's critical for them to understand from where the data came from and what fields mean. Trust and quality is the core for any dashboard to provide any value to end user.
Data Dictionary : Dashboard solution's data dictionary integration allows users to click on the chart and see the data dictionary. They can understand from where data has been pulled and if fields are confidential,
what meaning they carry for given business domain etc.
Data Lineage : Business users can leverage lineage feature to see from where data came from and what are the sources and processes, which transformed the data.
R is a language and environment for statistical computing. R provides a wide variety of statistical (linear and nonlinear modeling, classical statistical tests, time-series analysis, classification, clustering etc.). InsightLake Dashboard Solution integrates with R environment using RServe and allows building charts using R Scripts.
Any dashboard can be downloaded as PDF or PNG, which helps business users share information with each other or include the dashboards in their documents easily.
Confluence report generation allows easy integration and sharing with wider teams. Report allows user collaboration and discussion on dashboard reports easily.
Dashboards can be automated which enables business users to do: 1 Automate data extraction periodically from data sources
2 Generation of PDF, PNG or Confluence report page.
3 Email generated dashboard to specified user group
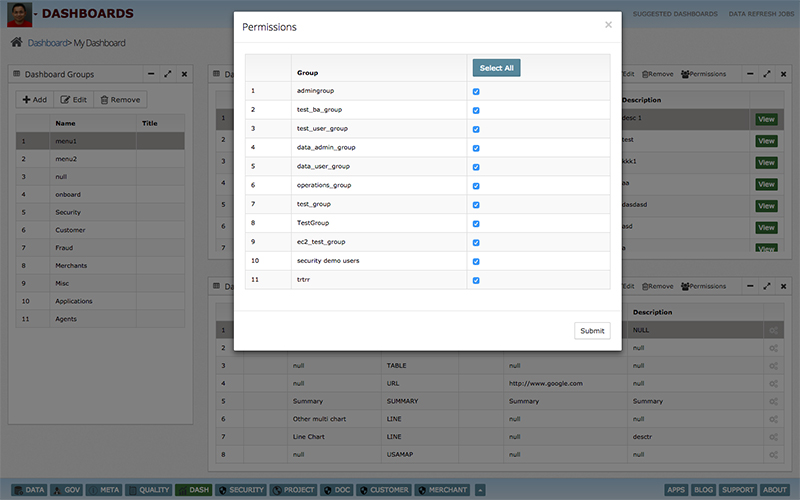
Dashboard access can be provisioned for users or user groups at dashboard or individual chart level. If a user is not allowed to see certain chart then that panel is not rendered.